
4 Steps To Using App Data “The Uber Way”
Image source: The Toronto Star
This post is Part 1/2 in our series on how to understand app analytics.
Click here for Part 2: How To Gain Actionable Insights From The Top 5 App Metrics
Data is having a moment right now.
I’m excited that we’re at a point where we don’t have to take huge stabs in the dark on business decisions that could spell ‘spectacular success’ or ‘epic fail’.
Yes, there are still risks with every app decision you make.
But data lowers these risks down to a non-scary level (that’s a technical business term) and provides a way to measure the effect of your efforts.
What you should be doing with your data

What you can uncover in data analytics is more than just numbers to prove that your app is growing.
Data analytics are gold nuggets of insights into real people’s behaviours, desires and actions.
“It’s not enough anymore to just capture data – everyone is collecting data, and most people aren’t doing anything with it.” Matt Denman, City Lead and Data Nerd at Uber Melbourne
You need to be analysing and comparing your data to boost your app’s performance.
This data will form the backbone of your future app updates and marketing strategies.
It’s easy to fall into a deep hole of ‘analysis paralysis’ where you feel so overwhelmed by numbers you can’t get out and see the light.
Don’t worry, we’ve all been there!
This post will show you how to use data the Uber way.
It will show you the 4 step process for analysing app data the smart way – driving user insights and helping you hit your app’s unique goals.
How does Uber use data?
“Uber isn’t a taxi company. It’s a data company” – Matt Denman, Uber Melbourne
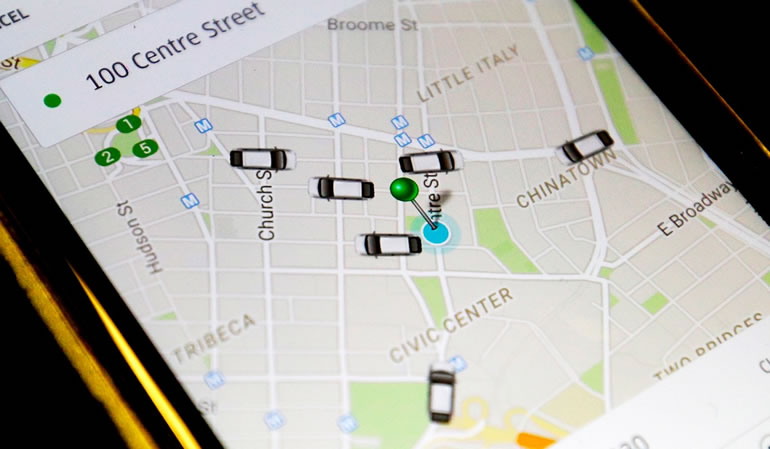
Uber has collected more data in its 5 years of operation than most big companies have in their last 100 years, and they have used it to drive constant, never ending improvements in their app.
At Buzinga’s Pollinate event in September, Matt Denman from Uber Melbourne discussed how Uber uses its data to inform every single decision.
Every business has a product or service they sell, but what makes them succeed is a key differentiator embedded in their business.
For Uber, this differentiator is the effective use of their proprietary data to deliver value to users.
Watch the entire presentation by Uber on how to build successful startups here.
It was through analysing passenger geodata and seeing that there is a consistent number of people in dense geographical areas at the same times each day, that they came up with UberPool concept.
UberPool delivers an immense amount of value to both passenger and drivers, effectively bringing Uber down to public transport prices.
In addition to geodata, the data Uber collects on passenger and driver ratings is key to maintaining the high quality of their service.
Uber is even negotiating partnerships with government and public transport authorities, which would give them access to Uber’s data so they can optimise their transport networks.
Given that Uber currently fills in transport deserts, this is a big step to fulfilling their promise to the public of easing congestion on roads.
If Uber didn’t track that data, these product and marketing decisions wouldn’t have happened.
“We don’t make gut calls. We never make a decision based on zero data.” – Matt Denman, Uber Melbourne
HOW TO ANALYSE APP DATA TO HIT YOUR APP GOALS EVERY TIME

Step 1. Only focus on actionable metrics
There are hundreds of metrics you can look at, and of course everyone wants to see all of them increase at once to prove their app is succeeding.
However, looking at too much insignificant data at once, with no defined processes, can make you lose sight of your goals.
Not all metrics are created equal.
Some will be important for your app, and uncover new insights. Others will just look good on paper.
Focus your energies on actionable metrics, not vague vanity metrics like number of downloads, which don’t have much usefulness.
Is it really that impressive that 100,000 people downloaded your app if 80,000 of them never opened it after installing?
Step 2. List metrics that make sense for your app’s purpose
The valuable behavior that you’re attempting to track will depend on your app’s unique vertical and purpose.
I can’t stress enough how important it is to first identify what your app’s unique purpose is.
This will hopefully be quite easy to zero in on – it’s driven by your Unique Selling Proposition, basically.
If you’re struggling to pinpoint one thing above all else, examine your business model – where are you getting your money from? Or, what ideal behaviour do you want to see from your users?
“Our clients tell us “I have about 300 KPIs I want to look at”. And we tell them: That’s a really bad idea.
Find 2 or 3 metrics that are meaningful, and capture the behaviour that you’re looking for. ” – Simon Kendall, Product Manager at AdEven.
These important metrics typically are driven by the industry your app operates in, and its lifecycle stage.
Driven by industry
Considering how different each app industry is, it doesn’t make much sense to use an unrelated industry’s metrics as the bible for what you should be measuring.
- Publishing apps typically want greater content consumption – engagement is a key focus for them, and therefore there metric focus would be increasing session time.
- Dating/social apps typically want social interaction – acquisition metrics may be a focus for them so they can increase their database and offer existing users more value.
- e-Commerce apps want sales – their focus may be on converting casual browsers into actual purchasers.
Here’s a practical example:
Flight and travels apps like TripAdvisor don’t get opened very regularly because users aren’t going on holiday every day (sad, I know). That’s why they would focus on increasing average session time.
But a dating app like Tinder wouldn’t necessarily want to increase average session time (that’d be creepy) but rather frequency of app opens, so opening the app and checking matches becomes a habit.
Driven by lifecycle stage
Key metrics are often weighted differently as a business matures.
A new app typically wants to build a solid userbase at first, and therefore may focus on acquisition and social sharing metrics.
Mature apps, on the other hand, would be more likely to focus on increasing customer lifetime value and re-engaging inactive users.
Step 3. List a specific goal and the metrics you need to get there
First of all, don’t focus on trying to improve every metric.
Yes, you want to see downloads, retention, session time, and everything else improve, but it won’t happen overnight.
Start with one clearly defined, specific goal you want to achieve, for example:
Increase average session time from 3.5 minutes to 5 minutes.
Increase average app launches from 1X per week to 3X per week.
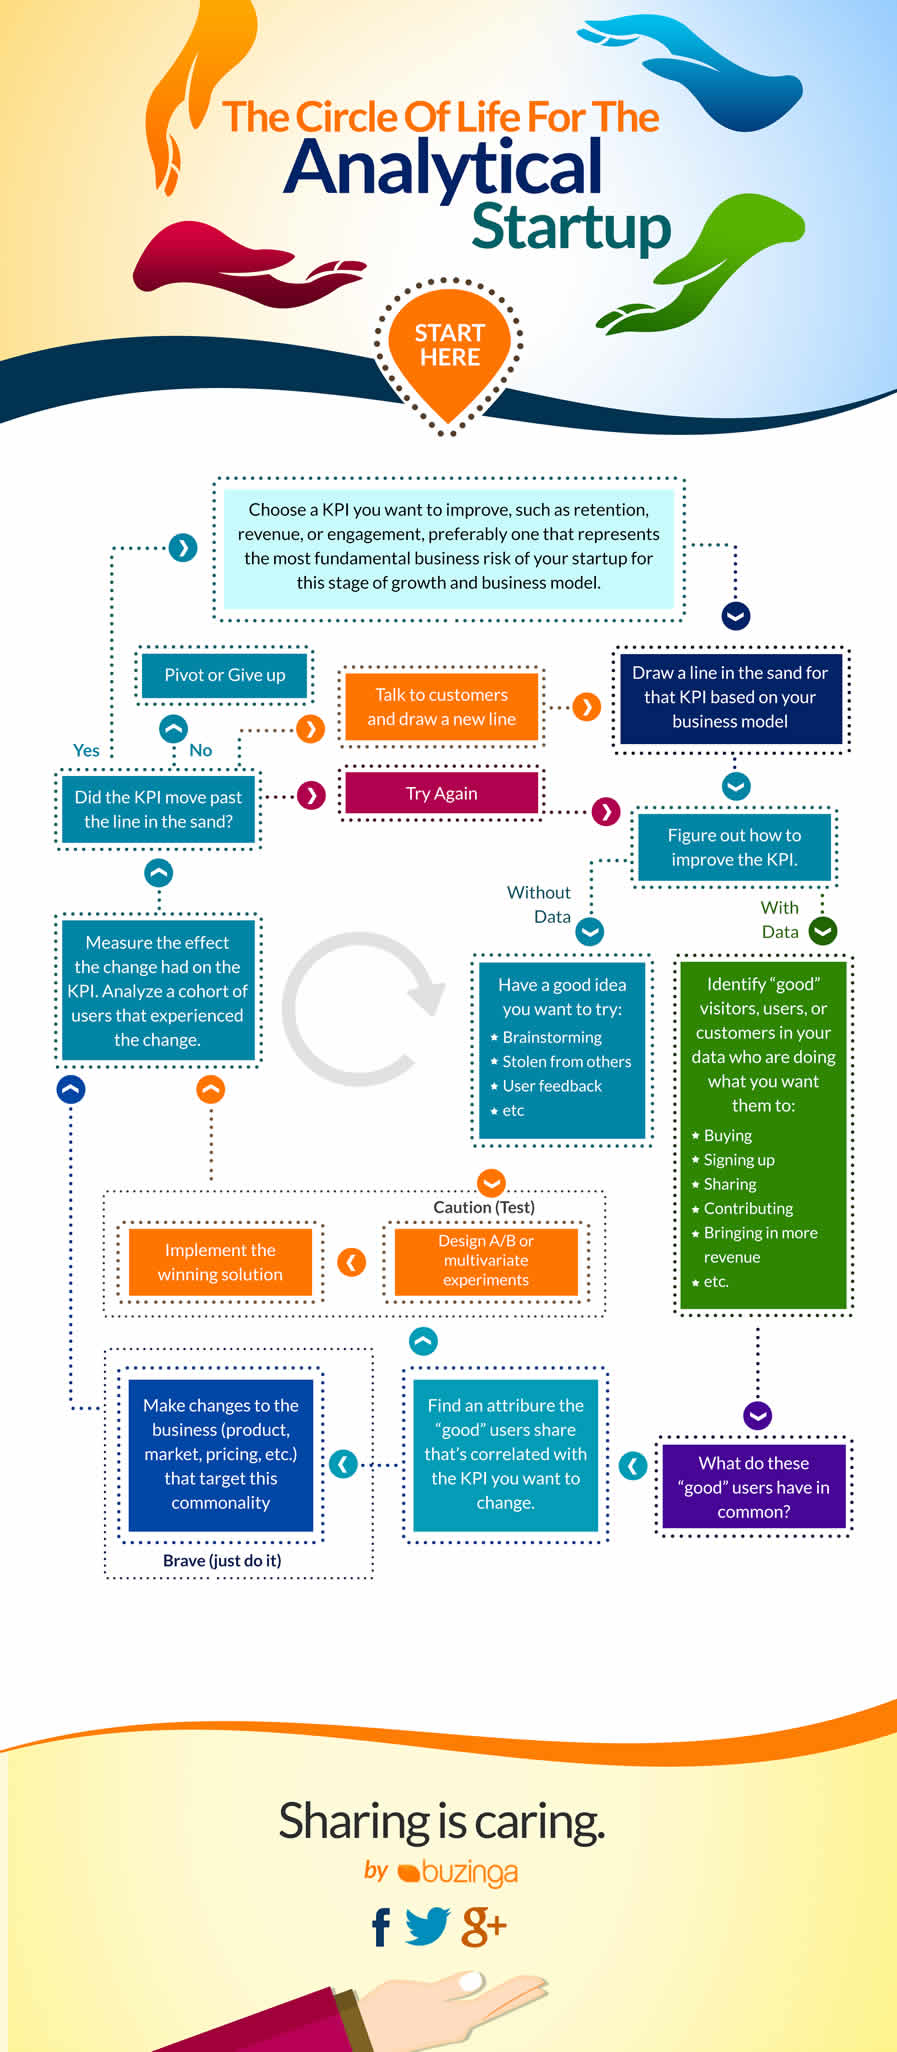
Now that you have that goal, figure out the metrics that make most sense for hitting it.
Follow this flowchart for setting and crushing your KPIs every time, in a state of constant improvement (Check out this blog for the detailed walk through).
Step 4. Use it to propel smart marketing strategies and UX updates
Time to put that data to good use!
Take what you’ve learned from your metrics, and decide what channels and strategies you will use to improve them.
Example scenario 1
Goal: Increase average session time from 3.5 minutes to 5 minutes.
This goal is engagement-focused.
You’d therefore probably be looking at journey pathways within your app, common drop-off points, and most used features/buttons.
You’ll be able to see where users are experiencing bottlenecks, getting frustrated and quitting, or where they are just getting confused.
If you see in journey pathways that someone is going back and forwards a lot, they are obviously looking for a button they can’t find intuitively.
Features that aren’t used often need to be analysed further to understand why, or it’s possible they just don’t add enough value and you should get rid of them.
See also: Why More Features Aren’t The Answer To Slow App Growth
Example Scenario 2:
Goal: Increase average app opens from 1X per week to 3X per week
For this goal you’ll be looking at your app launches, journey pathways and actions taken of your already active users, and comparing them to the same metrics of your inactive users.
What is the behaviour of your ideal users, and how can you push more existing users to be like them?
Perhaps they are using a specific feature that inactive users aren’t aware of.
Maybe they’re sharing their app progress to social media more often, and interacting frequently with their friends within the app.
See also: How To Build A Viral App Like Candy Crush
Zeroing in on this behaviour will shed light on those strategies that will likely be most effective at prompting inactive users to open your app.
For example, if you know that your most active users are all social sharers, sending a push notification “App X is better with friends! Add them from your phone’s contacts” could work better than pushing a special offer.
Don’t just pick and choose feel-good metrics because you’ve got too many to choose from.
Purpose-driven analytics are worth more than vanity metrics.
Wrapping up those numbers
It’s such an underutilized opportunity if you’re gathering data but not doing anything with it.
Collecting, monitoring and understanding your data will propel insights into future app marketing strategies and design updates.
The key is to focus on the metrics that reflect your app’s goals and purpose, analyse the behaviour of your best users, and figure out which strategies will push more of your users to be like them!
“For any business, investing in data is always going to pay huge dividends. That’s why we can so effectively scale this business.” Matt Denman, Uber Melbourne
Where to go next
Part 2: How To Gain Actionable Insights From The Top 5 App Metrics
10 Most Popular App Analytics Platforms
Flowchart: How Startups Can Crush Their KPIs Every Time
Infographic: How To Measure Your App’s Success
Latest posts by Logan Merrick (see all)
- Ep 18: Collective Campus’ CEO on Intrapreneurship and Corporate Innovation - December 20, 2016
- 50 User Engagement Strategies For Planning Memorable Mobile Experiences - December 19, 2016
- Latest Data: App Monetisation Trends And Drivers 2015-2020 - November 25, 2016

